Emotional Analysis Infographic
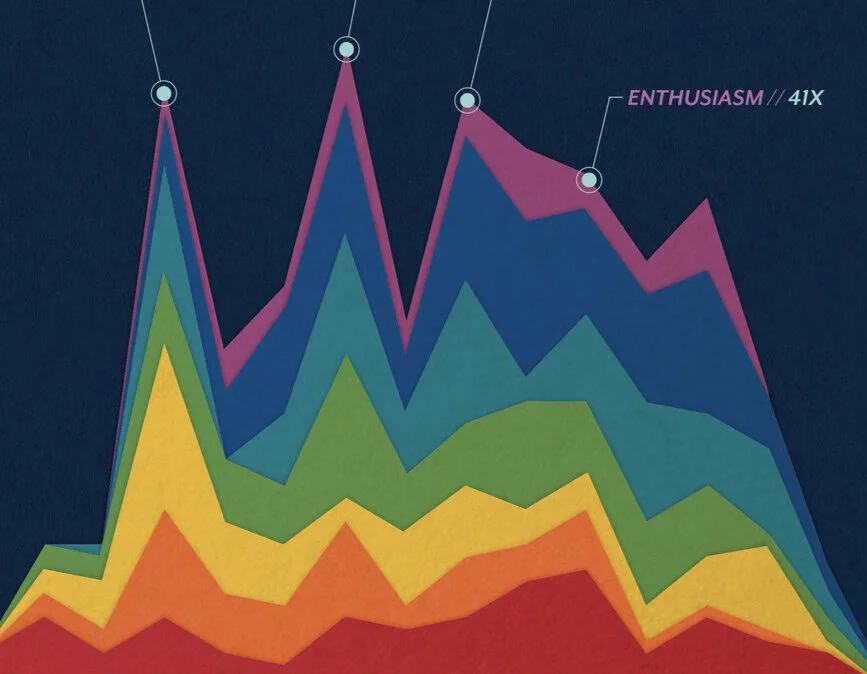
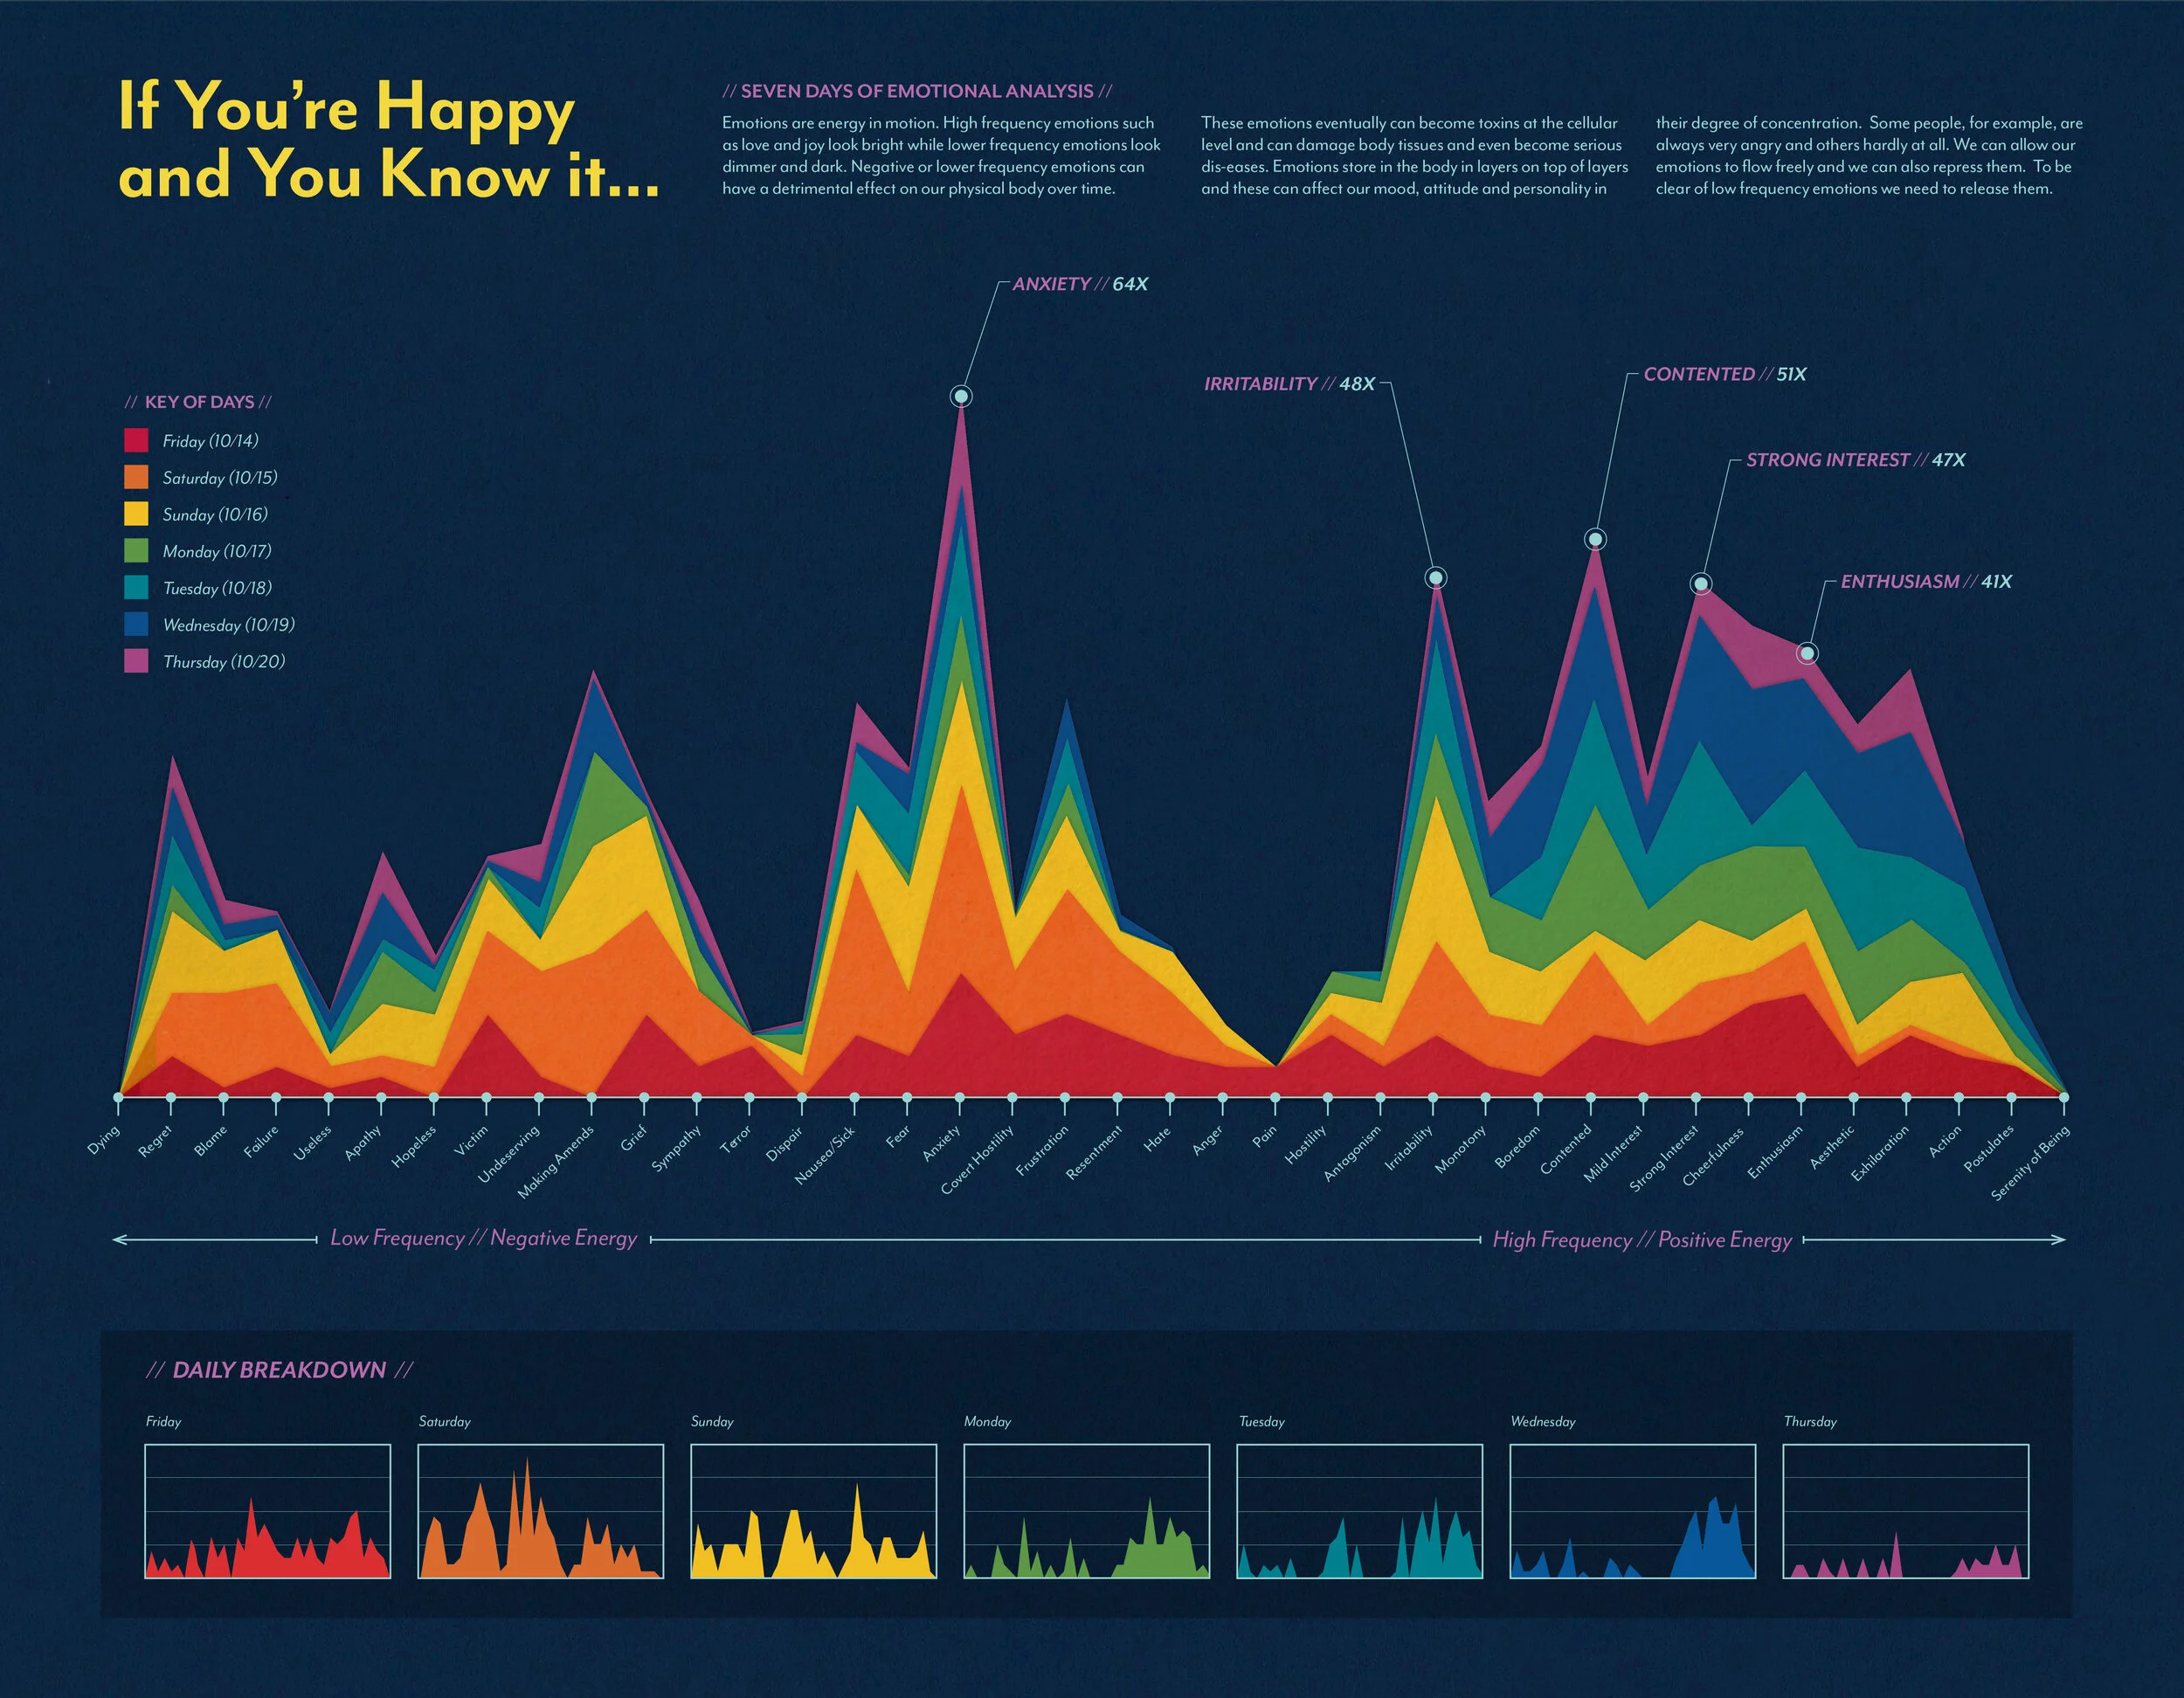
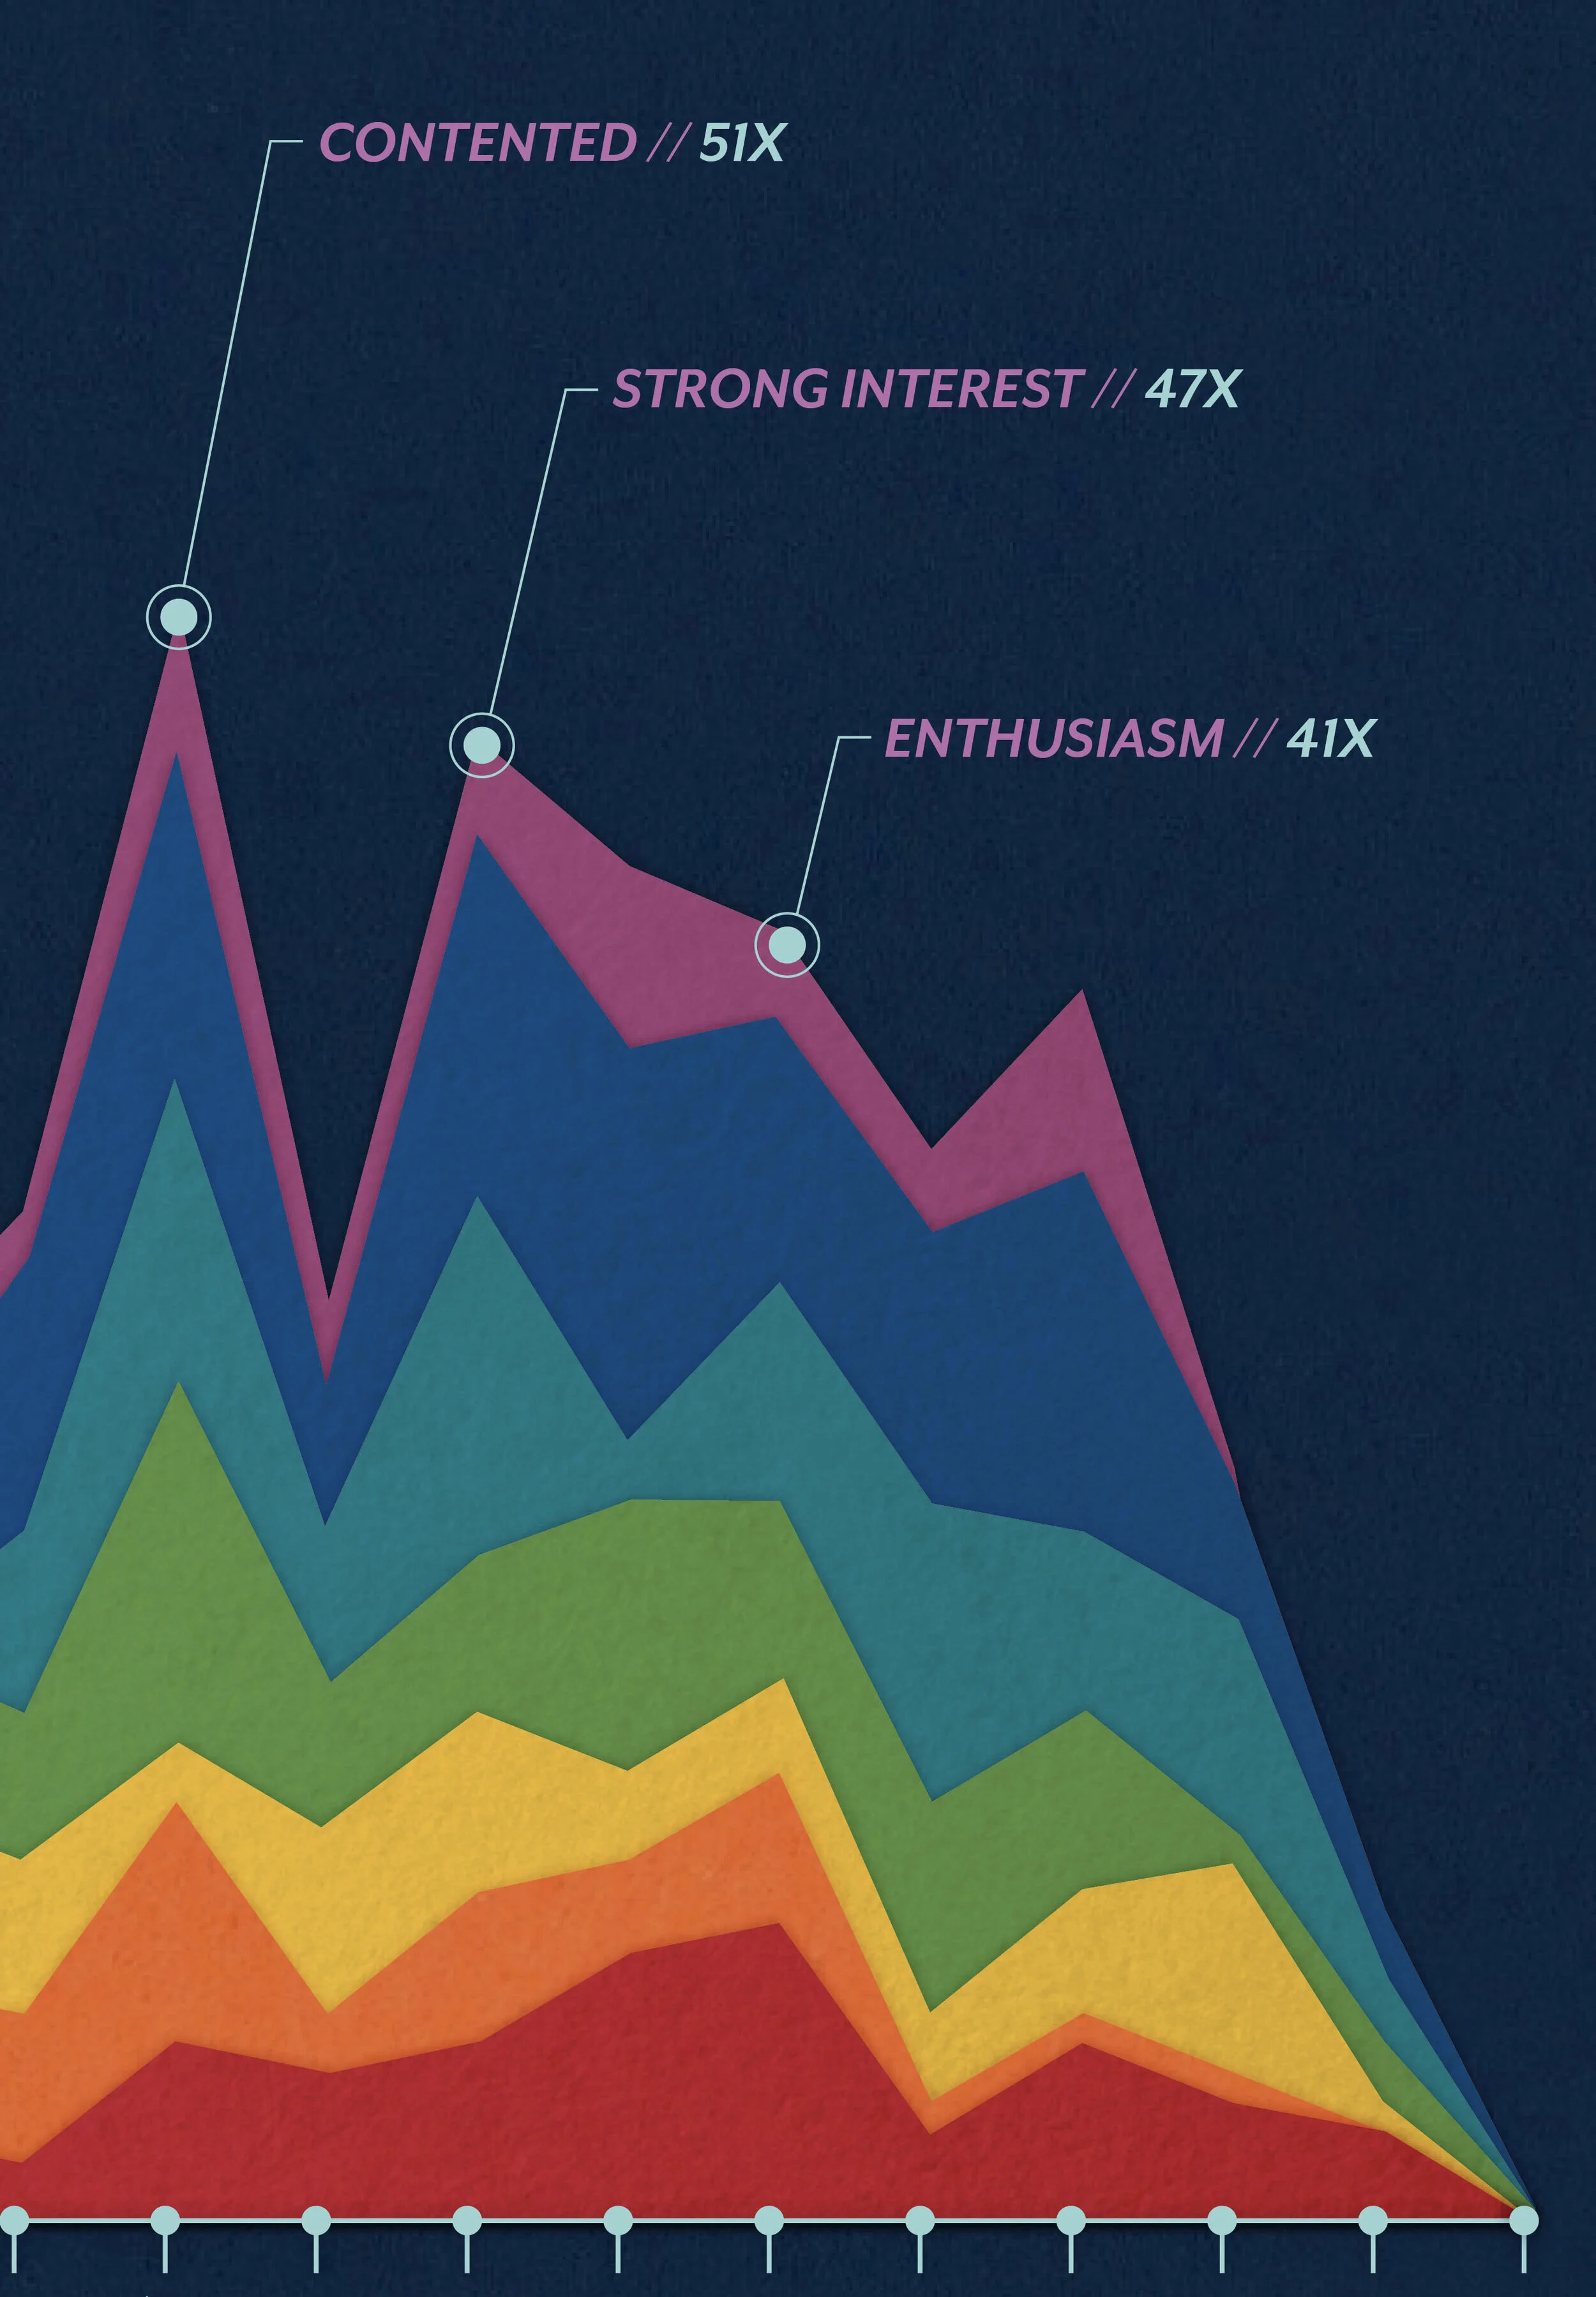
The creation of this infographic coincided with a period of time when I realized I was experiencing more stress than usual and felt it difficult to process and manage all that I was feeling. For seven days, I recorded my emotional status during waking hours at 30 minute intervals. I tallied the week of results and charted using a stack graph.
This personal experiment was helpful to observe overall emotion balance and address problematic areas, as well as, boost morale and reflect on good emotional experiences.
Stacked layers with digital drop shadow emphasize the complex layering of emotion.
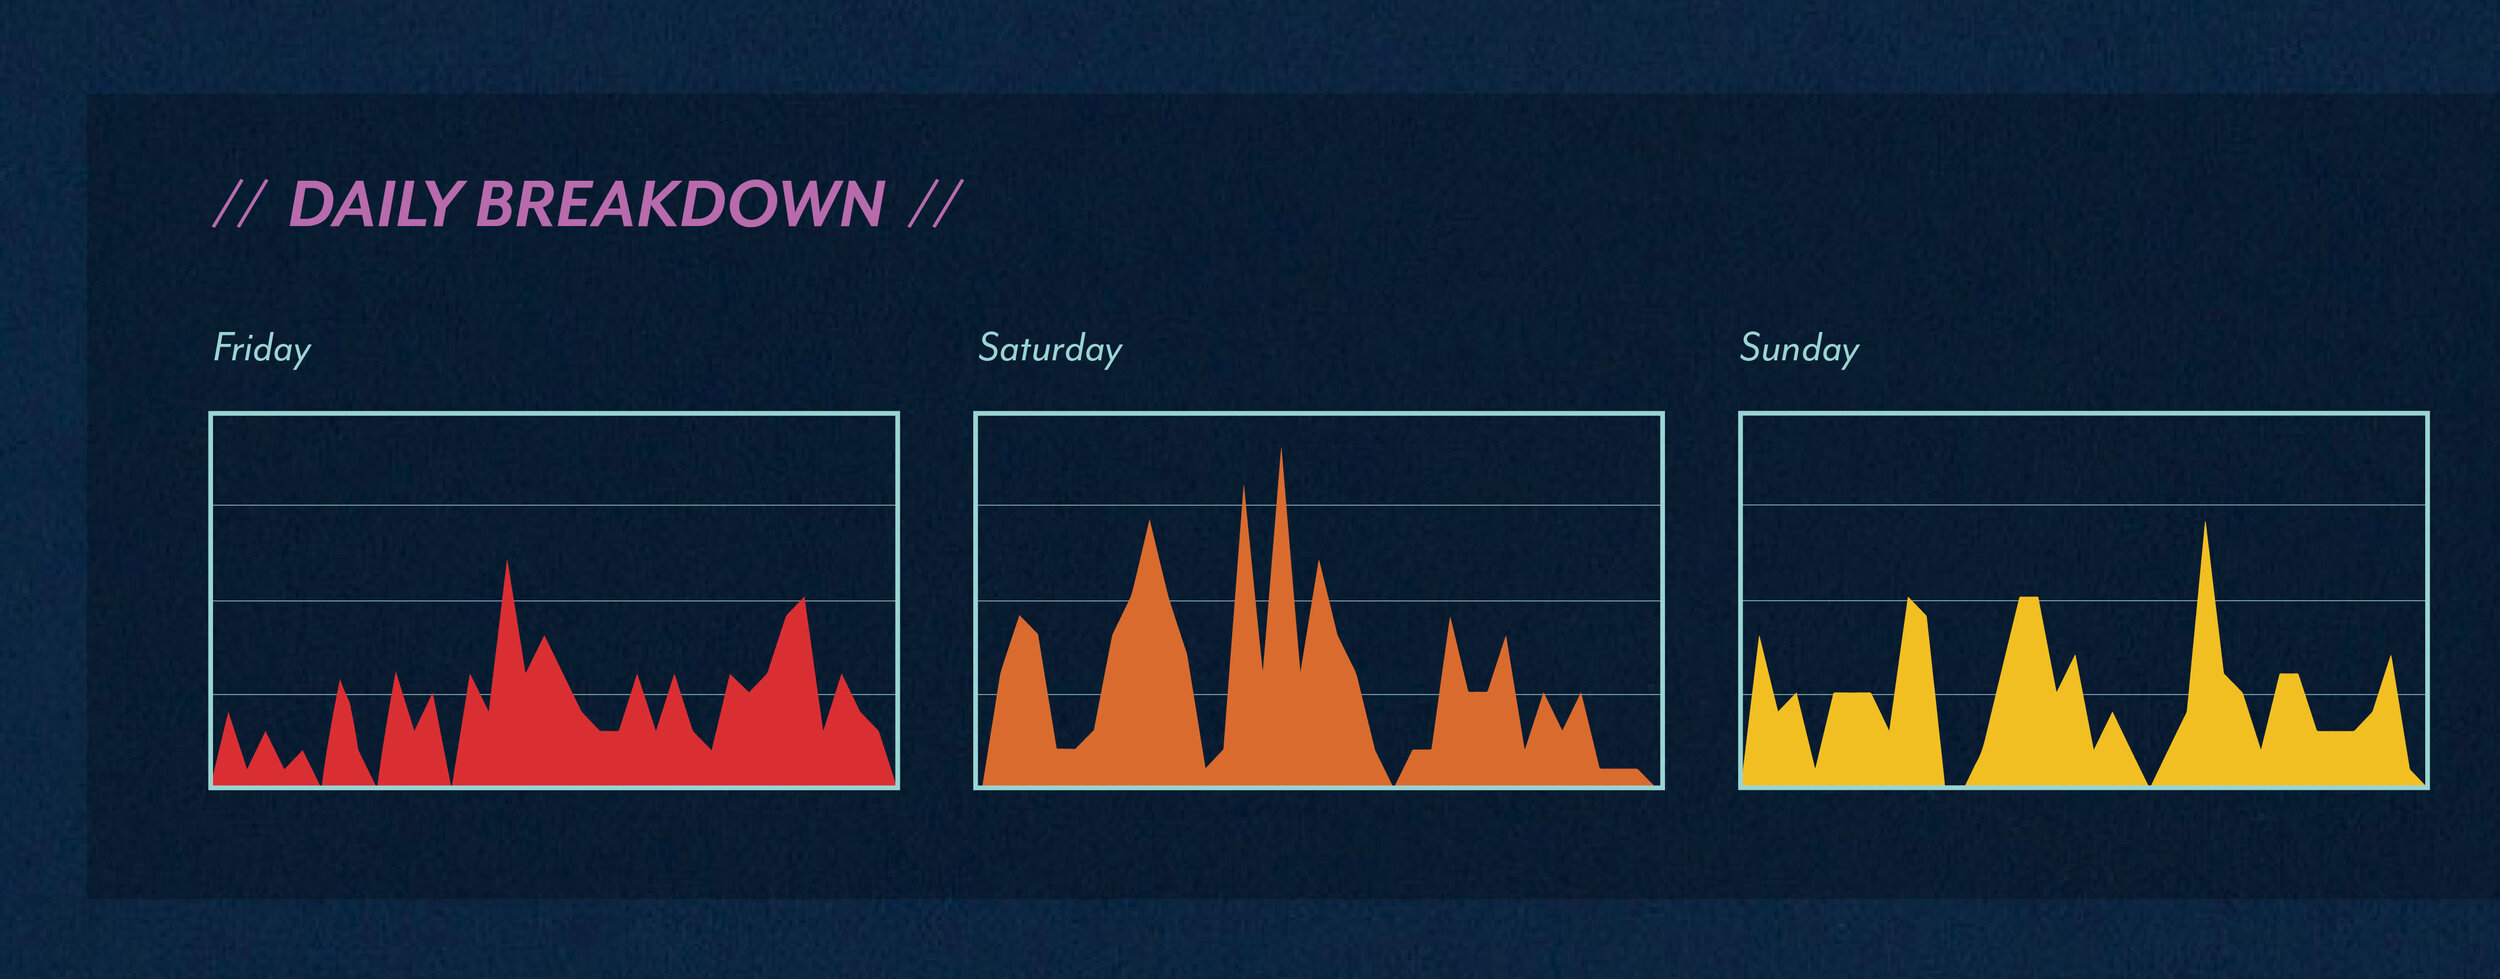
The bottom of the infographic features day by day breakdowns of the emotions felt on each single day.
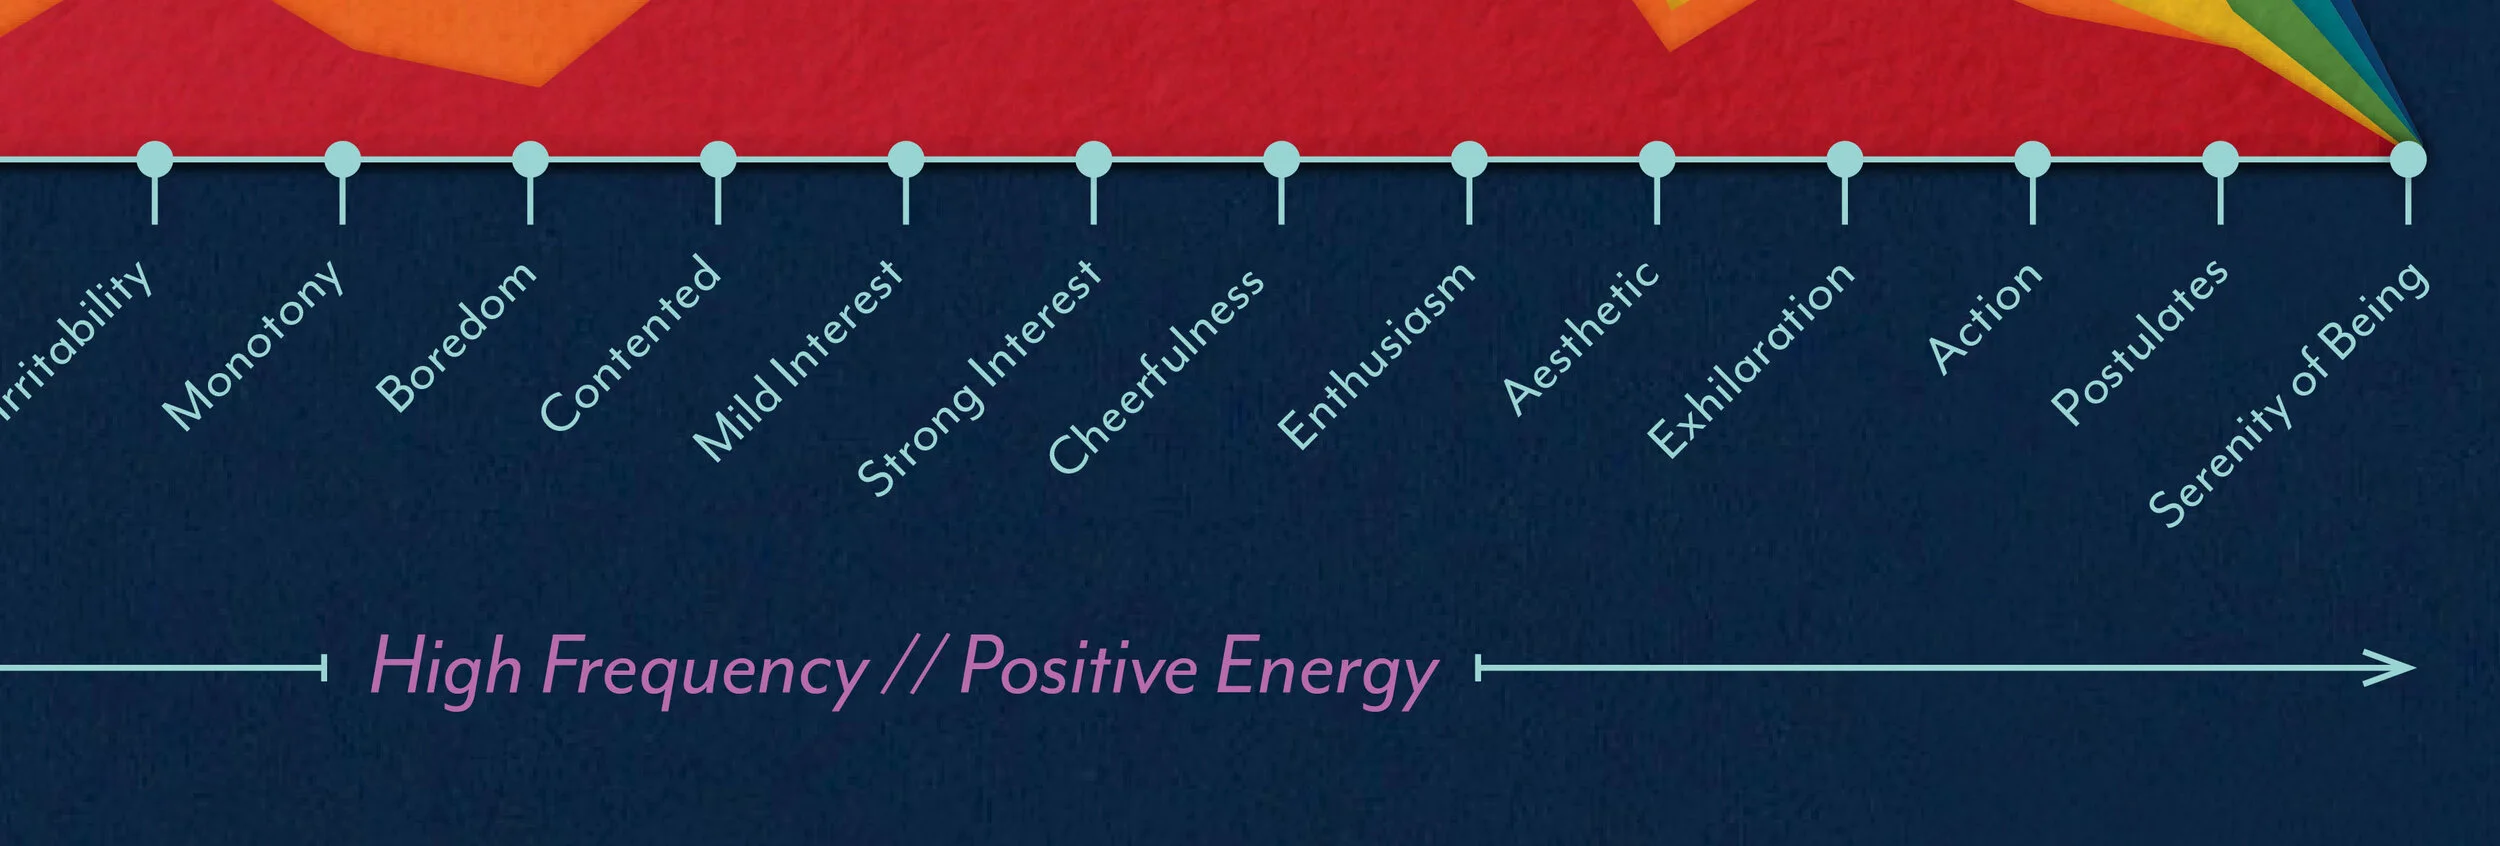
The spectrum of ranges from low frequency/negative energy emotions, such as sadness and anger, to high frequency/positive energy, such as cheerfulness and contentment.